The sine and cosine functions can be used to model fluctuations in temperature data throughout the year.
An equation that can be used to model these data is of the form: y = A cos B(x - C) + D, where A,B,C,D, are constants, y is the temperature in °C and x is the month (1–12).
Your task is to create a model of the data to predict the times during the year that a location would be pleasant to visit. This may be when the average monthly temperature is over 14°C.
| Month | Jan | Feb | Mar | Apr | May | Jun | Jul | Aug | Sep | Oct | Nov | Dec |
|---|---|---|---|---|---|---|---|---|---|---|---|---|
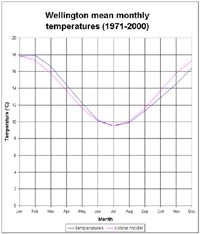
| °C | 17.8 | 17.9 | 16.6 | 14.4 | 12.0 | 10.2 | 9.5 | 9.9 | 11.3 | 12.9 | 14.5 | 16.4 |
Above is a table of average monthly temperatures at Wellington Airport from 1971-2000
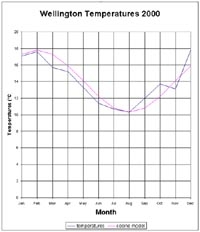
The long-term average temperatures for Wellington were given above. Below is a table of mean monthly temperatures for Wellington Airport for the year 2000.
| Month | Jan | Feb | Mar | Apr | May | Jun | Jul | Aug | Sep | Oct | Nov | Dec |
|---|---|---|---|---|---|---|---|---|---|---|---|---|
| °C | 17.1 | 17.6 | 15.7 | 15.2 | 13.3 | 11.0 | 10.7 | 10.3 | 12.0 | 13.7 | 13.1 | 17.8 |
Graph this data and write a trigonometric equation to model this data.
Solve the trigonometric equation derived above to find when the mean temperature will be over 14°C in Wellington.
Investigate a model for rainfall data or relative humidity.
To model a given situation, using trigonometry (including radian measure) to find and interpret measures in context, and evaluate findings. [M7.1] To find solutions, including the general solution, for trigonometric equations. [A8.15]
NCEA: C3.3 Use Trigonometry to solve problems
In place of the Wellington data, local climate data can easily be substituted to make the activity more meaningful to students. Data can be obtained from: www.niwa.co.nz/edu/resources/climate/ (for New Zealand) www.worldclimate.com/climate/index.htm (for the world)
The model for the long-term averages is y = 4.2cos ((x - 1)π/6) + 13.7 Replace January to December with 1 to 12. Alternative form: y = 4.2sin((x + 1)π/6) + 13.7
A = amplitude = (ymax - ymin)/2 B = 2π/12 C = units translated to the right D = ymin + amplitude = units translated up
To graph using Excel: x-values 1 - 12y-values for the cosine curve rounded to one decimal place use =ROUND(4.2*COS(((cell name-1)*PI())/6) + 13.7,1).
The model for the Wellington 2000 Temperatures can be either: y = 3.75cos ((x - 2)π/6) + 14.05 or y = 3.75cos ((x - 1)π/6) + 14.05 Replace January to December with 1 to 12.
The long-term average reduces the impact of one-off, very extreme events.
The climate model does not fit this data as well because of random climate variability.
To find when the temperature will exceed 14°C, substitute 14 for y in the equation. 4.2cos ((x - 1)π/6) + 13.7 = 14 4.2cos ((x - 1)π/6) = 0.3 cos ((x - 1)π/6) = 0.07143 (x - 1)π/6 = 1.4993 x - 1 = 2.8635 x = 3.8635
The general solution is x = 2nπ ± 3.8635 giving 3.86 or 10.15 i.e. the temperature will be above 14°C from the end of April to early October. Draw the line y = 14 on the graph and read off points of intersection.
Resource prepared by Lesley Mackintosh RSNZ Teacher Fellow 2001, NIWA
General | 16 October 2023
Information about climate and weather and links to climate-related websites.